.svg)

Financial Close KPIs: The Metrics Every Finance Team Should Track

Blog Summary / Key Takeaways
- Financial close KPIs measure close performance, not business performance. They tell you where the close slows down, where quality breaks, and where controls fail.
- Track speed and quality together. Pair close cycle time or days to close books with financial close accuracy metrics like post-close adjustment rate and rework rate.
- Instrument the workflow. If you do not capture timestamps and statuses automatically, teams stop trusting the dashboard.
- Run KPIs like an ops review. Treat every month-end as a repeatable process with owners, targets, and root-cause tags.
- Use Xenett as the operational layer. It helps teams execute the close with checklists, review stages, and real-time status so your financial close metrics stay consistent month to month.
Financial close KPIs matter because most close problems do not come from effort. They come from invisible bottlenecks, late adjustments, reconciliation backlogs, and unclear “done” definitions that leadership cannot see until it’s too late.
In this guide, you’ll get a practical KPI set, clear formulas, benchmark ranges by context, and a 30-day implementation playbook you can run without rebuilding your entire close.
This article fits Controllers, Accounting Managers, CFOs, Finance Ops teams, and outsourced accounting leaders who need faster closes without sacrificing accuracy or audit readiness.
What are financial close KPIs?
Financial close KPIs are metrics that measure how well your month-end or year-end financial closing process runs. They focus on speed, throughput, quality, and control so you can predict close outcomes and fix issues early.
These KPIs usually sit across your month-end close process: reconciliations, journal entries, reviews and approvals, reporting, and documentation
Financial close KPIs vs. financial KPIs (profitability/liquidity) - what’s the difference?
Financial close KPIs measure process performance. Financial KPIs measure business performance.
For example, gross margin and cash conversion cycle describe the business. Close cycle time and reconciliation completion rate describe the accounting operation that produces the financials.
This difference matters because you can improve your close even when revenue drops or expenses rise. You can also damage close quality while profitability looks fine.
Month-end close KPIs vs. year-end close KPIs
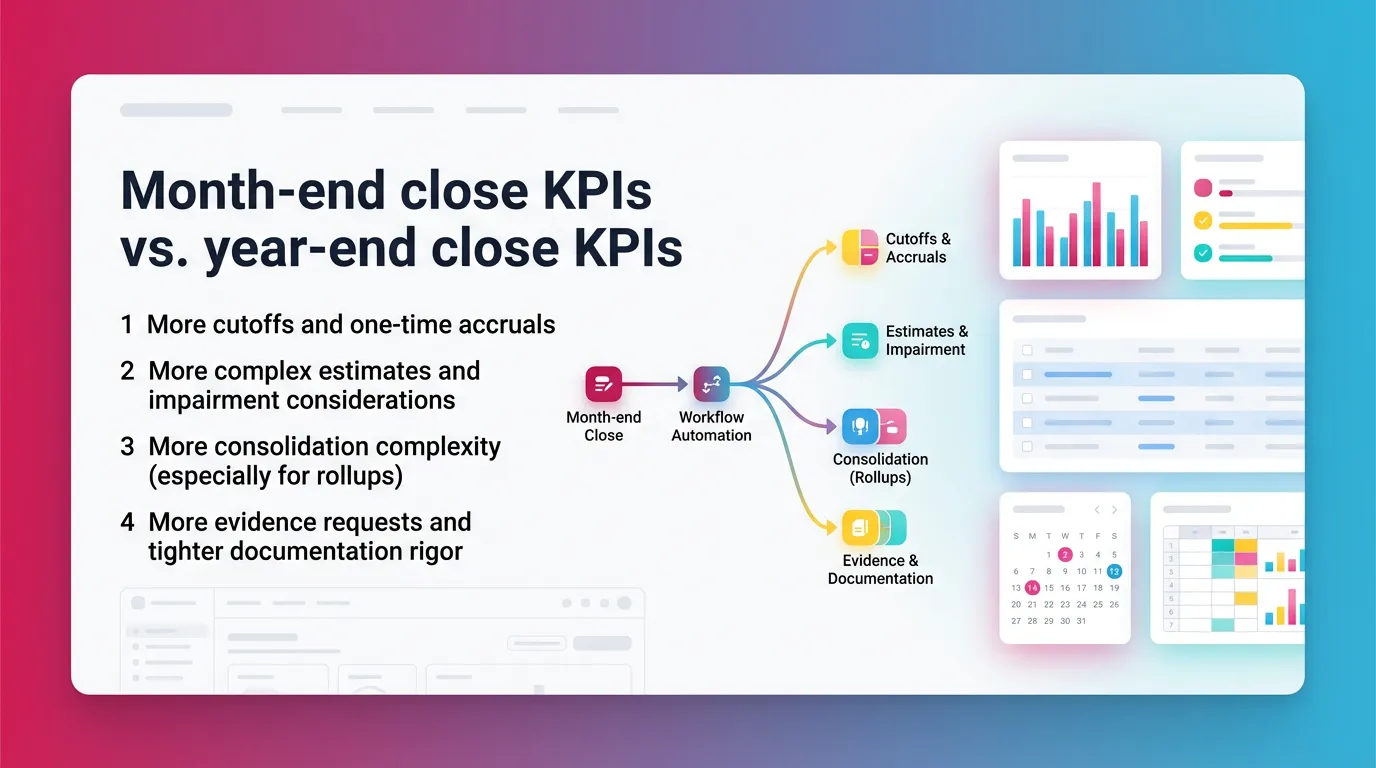
Month-end close KPIs track a repeatable monthly cadence. Year-end close KPIs track the same mechanics, but with more volume and higher documentation standards.
At year-end, you typically see:
- More cutoffs and one-time accruals
- More complex estimates and impairment considerations
- More consolidation complexity (especially for rollups)
- More evidence requests and tighter documentation rigor
Therefore, year-end KPIs should emphasize evidence completeness, approval discipline, and request turnaround time more heavily.
What a “good” KPI looks like (SMART + decision-useful)
A good KPI drives action. It stays specific, measurable, and consistent month to month so you can trust trends.
Use both leading and lagging indicators:
- Leading indicators predict trouble early. For example, task aging and “pending review” time-in-stage.
- Lagging indicators confirm outcomes. For example, post-close adjustment rate.
Avoid vanity metrics. “Number of tasks completed” means little if your team reopens half of them later.
The 12 most important month-end close KPIs (with formulas + what to do when they’re off)
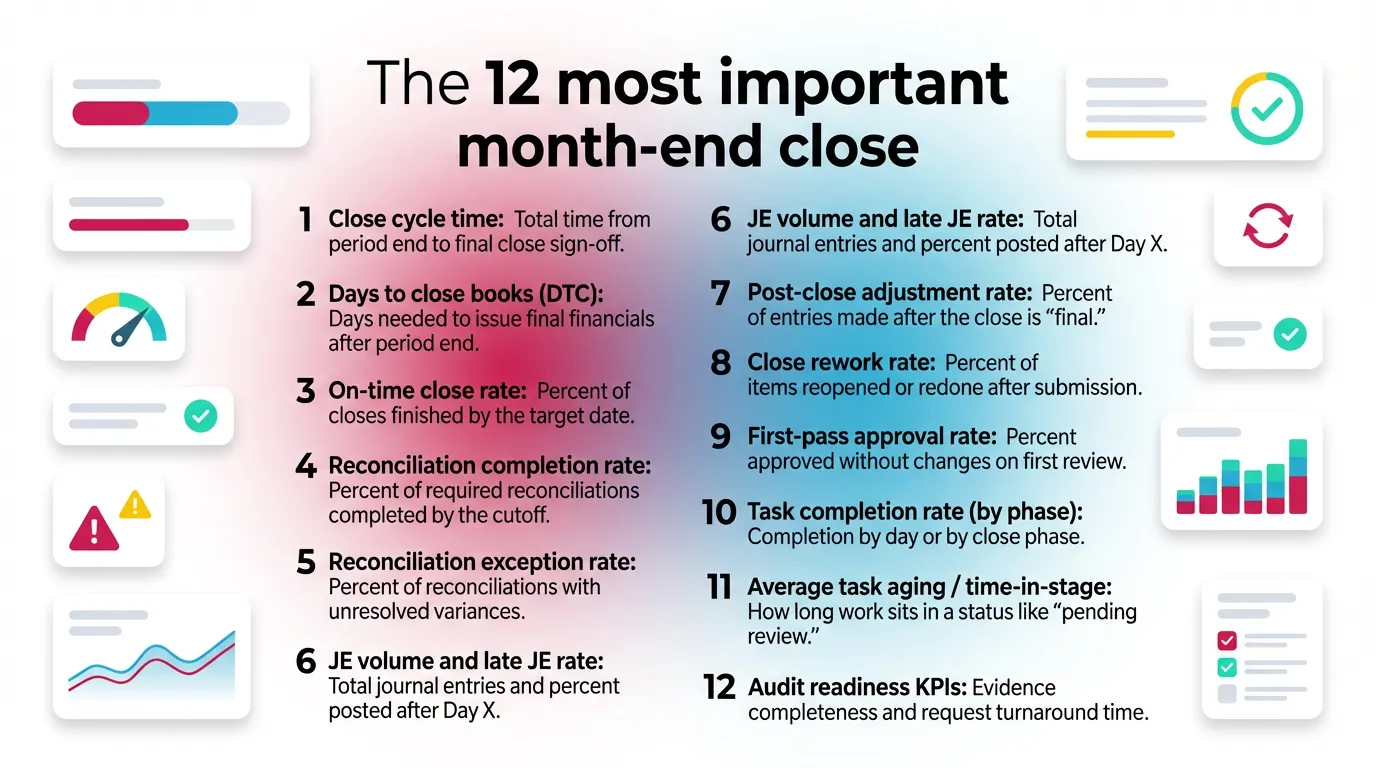
Below are the 12 month-end close KPIs most teams use to improve speed, accuracy, and control. Use them as a set, not as isolated scorecards.
12 month-end close KPIs
- Close cycle time: Total time from period end to final close sign-off.
- Days to close books (DTC): Days needed to issue final financials after period end.
- On-time close rate: Percent of closes finished by the target date.
- Reconciliation completion rate: Percent of required reconciliations completed by the cutoff.
- Reconciliation exception rate: Percent of reconciliations with unresolved variances.
- JE volume and late JE rate: Total journal entries and percent posted after Day X.
- Post-close adjustment rate: Percent of entries made after the close is “final.”
- Close rework rate: Percent of items reopened or redone after submission.
- First-pass approval rate: Percent approved without changes on first review.
- Task completion rate (by phase): Completion by day or by close phase.
- Average task aging / time-in-stage: How long work sits in a status like “pending review.”
- Audit readiness KPIs: Evidence completeness and request turnaround time.
1) Close cycle time (end-to-end)
Close cycle time measures the elapsed time from period end to final close sign-off. It tells you how long the entire close takes, including waiting.
- Definition: elapsed time from period end to final close sign-off
- Formula: Close completion timestamp − period end timestamp
What it reveals: systemic bottlenecks and dependency risk. If cycle time creeps up, something upstream breaks, start with reducing your close cycle time.
What to do when it’s off:
- Break cycle time into phases (pre-close, close, post-close) and measure each.
- Separate execution time from review time. Many teams find approvals cause most delay.
- Add dependency gates. For example, require subledger close before key reconciliations.
2) Days to close books (DTC)
Days to close books answers a simple leadership question: “When can we trust the numbers?” It focuses on when you issue final financials.
- Definition: number of calendar (or business) days to issue final financials
- Tip: define “closed” consistently (GL locked? reporting published? CFO sign-off?)
What it reveals: your reporting reliability and your ability to hit board and lender timelines.
What to do when it’s off:
- Standardize the definition of “books closed” in writing.
- Split entity DTC vs consolidated DTC. Consolidation often drives the real delay.
- Watch for late upstream inputs (AP cutoffs, revenue files, payroll).
3) On-time close rate
On-time close rate tells you if your close runs as planned. It also supports internal SLAs across entities, locations, or clients.
- Formula: closes completed by target date ÷ total closes
Use cases: multi-entity close governance, shared services performance, outsourced accounting SLA tracking.
What to do when it’s off:
- Set intermediate deadlines for high-dependency work (cash recs, intercompany).
- Track root causes for late closes. Do not accept “busy month” as a category.
- Use a close calendar with clear ownership and escalation rules.
4) Reconciliation completion rate (by deadline)
Reconciliation completion rate measures whether the team finishes reconciliations by the cutoff. It strongly correlates with close speed and audit readiness.
- Formula: reconciliations completed by cutoff ÷ total reconciliations required
- Break down by: bank, AR/AP, intercompany, balance sheet vs P&L
What it reveals: whether the close runs on stable foundations. Unreconciled accounts create late surprises.
What to do when it’s off:
- Tier accounts by risk. Require near-100% completion for key balance sheet accounts.
- Move low-risk reconciliations to a later phase or do them earlier in pre-close.
- Standardize templates and require supporting docs for key accounts.
For guidance on reconciliation discipline, see the AICPA’s audit risk perspective on reconciliations and account evidence expectations, and account reconciliation best practices. While you may not run audits, the control logic still helps.
5) Reconciliation exception rate
Exception rate tells you how often reconciliations finish with unresolved variances. It acts as a quality and control signal, not just a completion metric.
- Formula: reconciliations with unresolved variances ÷ total reconciliations
- What to track: aging of exceptions, root-cause categories
What it reveals: recurring process breaks like missing bank feeds, cutoff errors, mapping issues, or intercompany timing gaps.
What to do when it’s off:
- Require a variance explanation and an owner for every exception above threshold.
- Track exception aging. Old exceptions usually mean accountability gaps.
- Tag root causes (timing, data feed, posting error, subledger mismatch).
6) Journal entry (JE) volume and late JE rate
JE volume tells you how much change you push through the ledger. Late JE rate shows how much of that change arrives after your close should stabilize.
- Metrics: total JEs, JEs after Day X, manual vs automated
- Why it matters: late JEs correlate with rework and reporting delays
What it reveals: whether your close relies on end-of-month heroics. A high manual JE count often signals weak upstream systems or unclear cutoffs.
What to do when it’s off:
- Set a “JE cutoff ladder.” For example, Day 2 for routine accruals, Day 3 for true-ups, Day 4 only for Controller-approved items.
- Separate recurring JEs (automatable) from judgment JEs (review-heavy).
- Track manual vs automated financial close KPIs for JEs. Automation reduces variance.
7) Post-close adjustment rate (financial close accuracy metric)
Post-close adjustment rate measures how often you change the books after you call them “closed.” It is one of the clearest financial close accuracy metrics.
- Formula: # of post-close entries ÷ total entries (or $ value as % of materiality threshold)
What it reveals: weak cutoffs, rushed reviews, or reconciliations that happen too late. It can also reveal unclear definitions of “final.”
What to do when it’s off:
- Tighten cutoffs and enforce them through workflow gates.
- Add review requirements for high-risk accounts (revenue, accruals, intercompany).
- Separate “post-close true-ups” from “errors.” Track both, but fix errors first.
Practical example from real close work: when teams delay revenue subledger tie-outs until after management reporting, they often book “small” revenue true-ups post-close. Those small entries add up and erode trust. Move the tie-out earlier and require evidence before sign-off.
8) Close rework rate
Close rework rate tracks how often work gets reopened or redone. It usually points to unclear expectations or inconsistent review standards.
- Definition: tasks reopened, reconciliations redone, approvals reversed
- Formula: reopened tasks ÷ total tasks
Insight: rework hides inside “we’re almost done.” It inflates effort, increases late JEs, and extends close cycle time.
What to do when it’s off:
- Create completion criteria for common deliverables (bank rec, accrual support, flux).
- Standardize reviewer checklists so reviewers ask for the same things every month.
- Train on common errors and publish examples of “good” submissions.
9) First-pass approval rate (review efficiency)
First-pass approval rate measures how often items get approved without changes. It tells you whether the team submits review-ready work.
- Formula: items approved without changes ÷ total items submitted
- Works well for: reconciliations, flux explanations, JE approvals
What it reveals: the health of your preparation process and the clarity of your standards.
What to do when it’s off:
- Use templates for reconciliations and flux explanations.
- Require preparers to attach support before submission.
- Add “pre-review” checks for common issues (missing docs, wrong cutoff, no explanation).
10) Task completion rate (by phase)
Task completion rate shows whether the close progresses on schedule. Track it by close day or by phase so you can forecast slippage early.
- Track completion by close day (D0–D5), or by phase (pre-close / close / post-close)
What it reveals: whether you overload Day 1 and Day 2 with work that could happen earlier.
What to do when it’s off:
- Pull work into pre-close. For example, prepaid rollforwards and fixed asset updates.
- Split “execute” vs “review” tasks. Reviews often get buried.
- Rebalance workload by owner. One overloaded reviewer can stall everything.
11) Bottleneck metric: average task aging / time-in-stage
Average task aging tells you where work sits. Time-in-stage isolates whether execution stalls or approvals stall.
- Definition: average time tasks sit “in progress” or “pending review”
- Shows where approvals stall vs execution stalls
What it reveals: the real reason you miss the close date. Many teams do the work but wait days for review sign-off.
What to do when it’s off:
- Set review SLAs. For example, reviewers must respond within 24 hours.
- Add backup reviewers for peak periods.
- Reduce batch reviewing. Review daily to prevent pileups.
12) Audit readiness KPIs (control + evidence completeness)
Audit readiness KPIs measure documentation discipline and evidence completeness. They help you respond to requests faster and reduce fire drills.
- Examples:
- % of key accounts with supporting docs attached
- % of reconciliations with standardized templates
- request fulfillment time for audit PBC items
- Note: audit readiness is about documentation discipline and repeatability (not performing audits)
What it reveals: whether your close produces a clean, consistent record of what changed, why it changed, and who approved it.
What to do when it’s off:
- Require attachments for key account reconciliations before approval.
- Standardize naming conventions for support.
- Track request turnaround time and assign an owner for each request list.
KPI dashboard: the “one table” finance leaders actually use (snippet-friendly)
Leaders use KPI dashboards when they can scan them in under a minute. One table works better than ten charts because it forces clear definitions, owners, and first actions.
Recommended KPI table
How to choose the right financial close metrics (without over-tracking)
You only need enough financial close metrics to manage the work. Too many KPIs create dashboard fatigue and stop behavior change.
Start with a small leadership view, then add operational detail where you see recurring problems.
The CLOSE framework (simple KPI selection model)
Use the CLOSE framework to pick KPIs that cover the process end-to-end.
- Cycle time (speed): close cycle time, days to close books
- Load/throughput (volume, capacity): JE volume, tasks per preparer, accounts per reviewer
- Outcomes/quality (accuracy, rework): post-close adjustment rate, rework rate, exception rate
- Status visibility (work-in-progress transparency): task completion rate, time-in-stage
- Evidence & control (audit readiness): evidence completeness, request fulfillment time
If a KPI does not map to one of these categories, you probably do not need it.
KPI tiers by role
Align KPIs to decisions people actually make.
- CFO/Controller view (5–7 metrics max)
- Days to close books
- Close cycle time
- On-time close rate
- Post-close adjustment rate
- Reconciliation completion rate (key accounts)
- Audit readiness KPIs (evidence completeness)
- Accounting Manager view (8–12 operational KPIs)
- Add late JE rate, exception rate, rework rate, first-pass approval rate, time-in-stage
- Team-member view (task-level measures)
- Personal task aging, items returned from review, on-time task completion
KPI tiers by org complexity
A single-entity team can run a tight set of month-end close KPIs with simple definitions. A multi-entity environment needs segmentation.
Consider segmenting your dashboard by:
- Entity, region, or business unit
- ERP instance or subledger source
- Currency and consolidation layer
- Client (for outsourced accounting)
PE-backed rollups often need “entity close health” KPIs because one late entity delays consolidation.
Step-by-step: Implement financial close KPIs in 30 days (process + checklist)
You can implement financial close KPIs in 30 days if you focus on definitions first, then instrumentation, then targets. Most failures happen when teams jump straight to dashboards.
Week 1 - Define close boundaries and “done”
Define what starts and ends the close in plain language. Put it in writing and socialize it.
- Standard definitions: start point, end point, sign-off point
- Decide: calendar vs business days; entity vs consolidated close
Practical tip from running close retros: teams often define “close” as “GL locked,” but leadership defines it as “financials issued.” Pick one definition and track both timestamps if needed.
Week 2 - Build the close inventory (tasks, owners, dependencies)
List every close deliverable that must happen to publish financials in a month-end close checklist. Assign an owner and a backup.
- Map: reconciliations, JE process, subledger close, consolidation steps
- Identify “gates” (what must be completed before next stage)
Example gates that reduce chaos:
- Subledger close completed before revenue and AR tie-outs
- Bank recs completed before cash reporting
- Intercompany tie-outs completed before consolidation
Week 3 - Instrument the workflow (capture timestamps + statuses)
Capture timestamps and statuses in the system where work happens. Avoid spreadsheets for timestamping if you want trusted automated financial close KPIs.
- What timestamps to track (created, started, submitted for review, approved, closed)
- Minimum viable dataset for KPI accuracy
Minimum viable dataset that works in practice:
- Task created date/time
- Task status changes
- Submitted-for-review date/time
- Approved date/time
- Close sign-off timestamp
Week 4 - Set targets and start a monthly KPI review cadence
Set targets after you baseline at least one close. Then run a monthly retro like an ops team.
- Target-setting approaches: baseline + incremental improvement, peer benchmarks, SLA approach
- Monthly close retro: top 3 delays, top 3 quality issues, top 3 fixes
Keep the retro tight:
- One owner per fix
- One deadline per fix
- Measure impact next month using the same KPI definitions
30-day KPI implementation checklist (download-style section)
- Definitions documented
- Owners assigned
- Data source verified
- Dashboard created
- Review meeting scheduled
- Root-cause tagging enabled
Best practices to improve close cycle time and accuracy (what consistently works)
Most teams improve close cycle time with the same best practices for month-end close: they standardize work, reduce late inputs, and make review a visible stage. They do not “work harder.”
Standardize close phases (pre-close, close, post-close)
Standardize phases to reduce Day 0 load. This simple change often shortens days to close books without increasing risk.
- Reduce D0 load with accrual prep and early reconciliations by managing accruals effectively.
Good pre-close candidates:
- Recurring accrual models and templates
- Fixed asset rollforwards
- Prepaid amortization
- Low-risk balance sheet reconciliations
Make reviews a workflow stage, not an email thread
Make review a tracked stage with a clear owner and SLA. Email-based review hides queues and creates false “in progress” signals.
- Reduce “pending review” ambiguity
When you treat review as a stage, you can measure:
- Time waiting for review
- First-pass approval rate
- Rework rate by reviewer or account type
Prioritize high-risk accounts with tighter controls
Apply tighter controls where risk concentrates. You do not need the same rigor everywhere.
- Material accounts, volatile accounts, manual-heavy areas
Examples of high-risk areas:
- Revenue and deferred revenue
- Inventory and COGS
- Accrued expenses with high judgment
- Intercompany and eliminations
Shift from manual to automated financial close KPIs (where possible)
Consider automating your month-end close for repeatable steps and measure the impact. Track automation rate so you can tie improvements to reduced rework and faster closes.
- Track “automation rate” for repetitive steps (imports, matching, rollforwards)
- Measure impact on rework and days to close books
Run a “variance hygiene” program
Variance hygiene reduces the time you waste explaining noise. It also improves management trust in the numbers.
- Flux thresholds, explanation completeness, repeatable templates
A simple approach:
- Set thresholds by account type (percent and dollar)
- Require explanations that state “what changed” and “why it changed”
- Reuse a template so reviewers can scan quickly
Common mistakes when tracking month-end close KPIs (and how to avoid them)
Most KPI programs fail because teams measure what is easy, not what is useful. Fix the definition and data problems first so the metrics drive decisions.
Mistake 1 - Measuring only speed, not accuracy
Speed alone creates bad behavior. Teams push work through and “fix it later,” which increases post-close adjustments.
- Why it backfires: faster close with more post-close adjustments
Avoid it by pairing:
- close cycle time with post-close adjustment rate
- days to close books with rework rate and exception rate
Mistake 2 - Inconsistent definitions of “closed”
If “closed” changes every month, your trend lines lie. Leadership stops trusting the dashboard.
- Creates misleading trend lines
Fix it by documenting:
- When the clock starts
- When the clock stops
- Who signs off
- What artifact proves completion (locked period, report published, sign-off recorded)
Mistake 3 - Tracking too many KPIs
Too many metrics create noise. Teams stop acting because every metric looks “red” somewhere.
- Leads to dashboard fatigue and zero action
Fix it by using tiers:
- 5–7 for leadership
- 8–12 for close operators
- Task-level measures for individuals
Mistake 4 - KPI data captured manually (low trust)
Manual tracking creates missing timestamps, biased reporting, and debates about accuracy. People game the numbers unintentionally.
- Results: missing timestamps, biased reporting
Fix it by capturing status and timestamps where work happens. This also enables automated financial close KPIs you can rely on.
Mistake 5 — No root-cause tagging
If you only know that the close ran late, you learn nothing. Root-cause tags turn metrics into process improvement.
- You see delays but don’t learn why they happen
Start with a short list:
- Waiting on data
- Waiting on review
- Rework required
- System issue
- Staffing/capacity
- One-time item
How Xenett operationalizes close KPI tracking with repeatable workflows (non-promotional, educational)
You improve financial close KPIs when your workflow stays consistent. Xenett helps teams run the close with repeatable checklists, structured reviews, and real-time visibility so KPI data reflects real work.
Close task and checklist management (turn KPIs into execution)
Standardized close checklists create consistent work and consistent measurement. They reduce missed handoffs and hidden work.
- Standardized month-end close checklists by entity/client
- Owners, due dates, dependencies to reduce missed handoffs
- KPI tie-in: improves task completion rate, reduces task aging
If you want a baseline structure, Xenett’s month-end close workflow resources can help you standardize tasks and phases: https://xenett.com/
For a deeper workflow view, see close management concepts here: https://xenett.com/financial-close-checklist
Review and approval workflows (structured “first-pass” controls)
Structured review stages make review time measurable. They also reduce back-and-forth and improve submission quality.
- Route reconciliations and close deliverables through defined review stages
- Clear accountability for “pending review” vs “in progress”
- KPI tie-in: improves first-pass approval rate and reduces rework rate
This matters most when you manage multiple preparers and a small reviewer group. You can see review queues instead of discovering them on Day 4.
Visibility into close status and bottlenecks (real-time progress, fewer status meetings)
Real-time status helps you run the close like an operational process. It reduces daily “Where are we?” meetings because the work speaks for itself.
- Central view of what’s done, what’s stuck, and where workloads cluster
- KPI tie-in: reduces close cycle time and helps explain variance in days to close books
When you can see time-in-stage, you can separate “execution delay” from “approval delay.” Therefore, you fix the right problem faster.
Financial close KPI benchmarks (how to think about targets)
Benchmarks help you set direction, but they do not replace internal baselines. Complexity drives most differences in financial close metrics across companies.
What “good” looks like depends on complexity
A “good” close depends on:
- Company size and transaction volume
- Entity count and consolidation complexity
- ERP maturity and system integrations
- Industry compliance requirements and control expectations
A single-entity professional services firm can close faster than a multi-entity, multi-currency manufacturer. Compare yourself to yourself first.
Benchmark ranges to consider (use with caution)
Use ranges as planning inputs, not report-card grades.
- Close cycle time bands (simple vs complex environments)
- Simple single-entity: often low single-digit days
- Multi-entity and consolidation-heavy: often extends into mid-to-high single digits or longer, depending on readiness and systems
- Reconciliation completion expectations (by criticality tier)
- Key balance sheet accounts: target near-100% by the close cutoff
- Lower-risk accounts: acceptable to complete later if you document the approach
- Acceptable post-close adjustment levels (relative to materiality)
- Best practice targets align to your materiality thinking and internal tolerance
- Watch trend and frequency more than absolute dollars
Set targets using a maturity curve
Use a maturity curve so targets feel achievable and operationally grounded.
- Baseline → stabilize → standardize → automate → optimize
Example:
- Baseline: measure current days to close books and exception rate
- Stabilize: enforce definitions and review gates
- Standardize: templates, consistent evidence, and phases
- Automate: reduce manual JEs and repetitive reconciliations
- Optimize: reduce time-in-stage and improve first-pass approval rate
FAQ
What are financial close KPIs?
Financial close KPIs are metrics that measure the speed, quality, and control of the month-end or year-end close process—such as close cycle time, days to close books, reconciliation completion rate, and post-close adjustments.
They help teams find bottlenecks, reduce errors, and improve visibility.
What is the most important month-end close KPI?
Close cycle time (or days to close books) is usually the top KPI because it reflects end-to-end performance, but it should be paired with an accuracy KPI like post-close adjustment rate.
Speed without accuracy creates rework and late surprises.
How do you calculate days to close books?
Days to close books equals the number of days between the period end date/time and the final close sign-off (or defined “close complete” timestamp).
Decide whether you track calendar days or business days, then keep it consistent.
What is a good reconciliation completion rate?
A good reconciliation completion rate is one that consistently hits your internal deadline for all high-risk accounts; many teams target near-100% for key balance sheet accounts by the close cutoff.
Tier accounts by risk so you apply stricter expectations where it matters.
What are financial close accuracy metrics?
Common financial close accuracy metrics include post-close adjustment rate, reconciliation exception rate, rework rate, and first-pass approval rate.
These measures show whether your close produces stable, review-ready numbers.
What are audit readiness KPIs for accounting teams?
Audit readiness KPIs measure how complete and consistent your close documentation is—such as the percent of key accounts reconciled with support attached and the average time to fulfill information requests.
They improve repeatability and reduce last-minute document hunts.
How can teams improve close cycle time without sacrificing quality?
Standardize close tasks, enforce review gates, reconcile high-risk accounts earlier, reduce late journal entries, and track rework/post-close adjustments to prevent “fast but wrong” closes.
Focus on time-in-stage because approvals often create the biggest delays.
Conclusion
Financial close KPIs work when you treat the close like a measurable operating process. Track a balanced set of month-end close KPIs that cover speed, quality, visibility, and evidence for preparing for audit readiness. Then run a short monthly retro and fix the top issues first.
If you want to make KPI tracking easier, start by standardizing your close tasks, review stages, and definitions in one place. Use that workflow foundation to produce consistent financial close metrics every month.