
.svg)

Month End Close KPIs: Metrics Every Finance Team Should Track

Blog Summary / Key Takeaways
- Month end close KPIs should measure time, quality, rework, and efficiency.
- The days to close metric needs one clear “close complete” definition.
- Pair close cycle time KPI targets with quality KPIs. Speed alone lies.
- Track reopens, post-close adjustments, and exception rates to see churn.
- Use leading close performance metrics like WIP aging to predict delays.
What This Guide Covers
- Covers: month-end close KPIs, financial close KPIs, month end close metrics, close performance metrics, days to close metric, close cycle time KPI, benchmarks, and improvement levers
- Doesn’t cover: a step-by-step month-end close process walkthrough (assume you already have one)
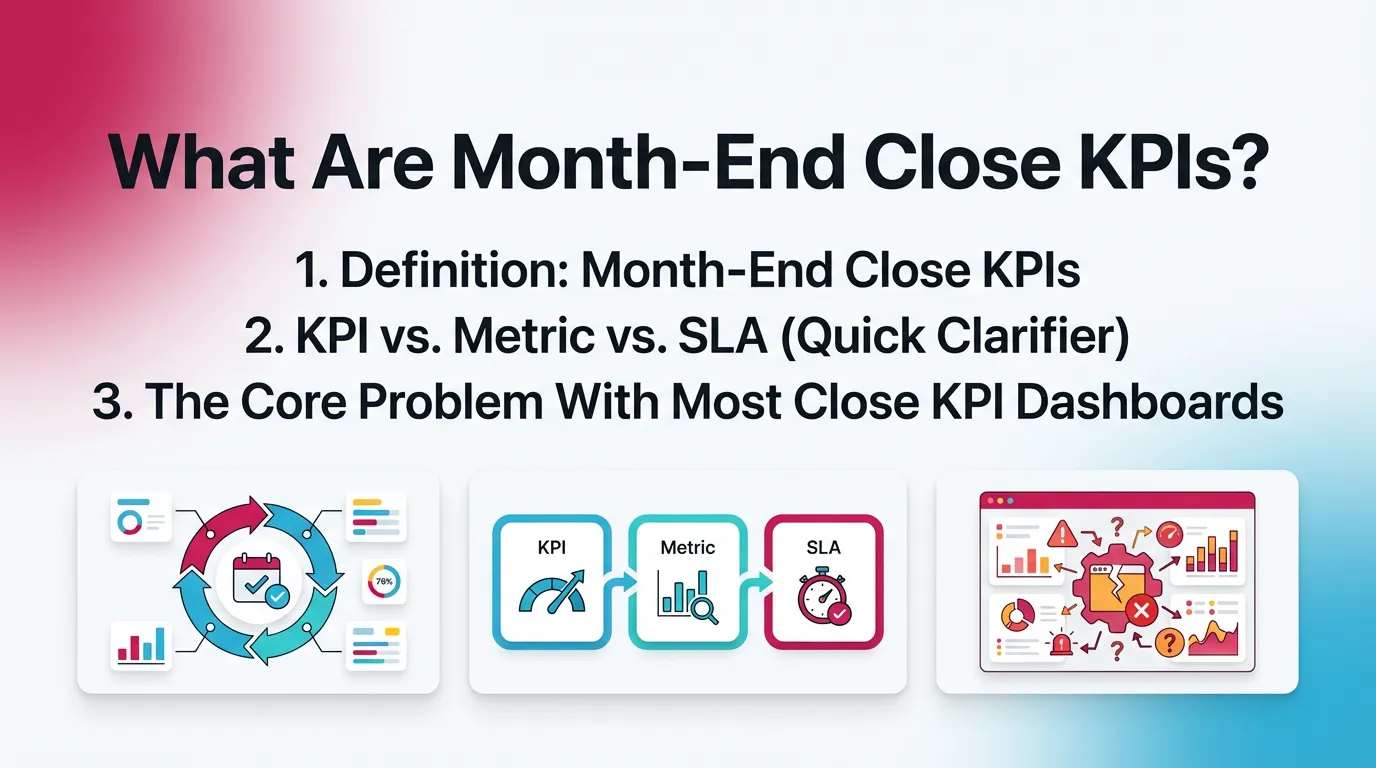
What Are Month-End Close KPIs?
Month-End Close KPIs
Month-end close KPIs quantify close speed and close quality at the same time. They also measure stability and effort, so you can see if the team “wins” by working smarter or by working longer.
In practice, the best accounting KPIs for close answer four questions:
- How fast did we close, and did we hit the target date?
- How accurate were the financials when we said “done”?
- How much work did we redo?
- How much effort did the close consume?
KPI vs. Metric vs. SLA (Quick Clarifier)
A metric measures something. A KPI measures performance. A target sets the bar.
- Metric: any measurable value (for example, reconciliations completed)
- KPI: metric tied to a performance outcome (for example, close cycle time KPI)
- SLA/Target: agreed threshold (for example, “close by day 5”)
This matters because teams often report many month end close metrics. However, they fail to pick the few that change behavior.
The Core Problem With Most Close KPI Dashboards
Most dashboards reward speed and ignore accuracy. That pushes the wrong behavior.
Common issues I see in real close environments:
- Teams overweight “days to close” and underweight post-close corrections.
- Teams measure “done” but ignore how often work gets reopened.
- Teams use different definitions across entities and clients.
- Review standards live in someone’s head, not in a system.
If you want close performance metrics you can trust, you need consistent definitions and a balanced model.
The Close KPI Model: 4 Dimensions That Capture Real Performance
Use this model to structure your month-end close KPIs and your dashboard. It keeps the close cycle time KPI from becoming the only story.
1) Time (Speed + Predictability)
Time KPIs track how long the close takes and how reliably it finishes on time. Predictability matters because leaders plan around it.
If your close finishes in 5 days one month and 10 the next, you do not have control. You have luck.
2) Quality (Accuracy + Integrity of Accounts)
Quality KPIs track whether the close produces reliable financials. They also show if the team catches issues before sign-off.
Quality shows up as:
- Fewer post-close adjustments
- Cleaner reconciliations
- Fewer unexplained flux items
- Fewer material corrections after reporting
3) Rework (Cleanup + Churn)
Rework KPIs show how much work you repeat. They also expose late discoveries and poor handoffs.
Rework often hides behind “we always clean that up next week.” However, the cleanup still consumes capacity.
4) Efficiency (Effort + Throughput)
Efficiency KPIs track the effort needed to close at an acceptable quality level. They highlight bottlenecks and high-touch accounts.
Efficiency is where you find leverage. For example, two teams can both close in 6 days. One needs 220 hours. One needs 120.
KPI Scorecard: The Most Useful Month-End Close KPIs
These are the month-end close KPIs that work in the real world. They stay stable across teams and systems. They also translate well into financial close KPIs for quarter-end and year-end.
Month-End Close KPI Scorecard
The KPI Everyone Asks For: How to Measure “Days to Close” Correctly
Measure days to close from period end to a single, documented “close complete” event. Then keep that definition stable. This makes the days to close metric comparable month to month.
When teams argue about the close cycle time KPI, they almost always argue about the end timestamp.
What Counts as “Close Complete”
Pick one definition. Document it. Train to it.
Common options:
- Financial statements delivered internally
- Review sign-offs completed
- Lock date set / period closed in the GL
- Client delivery date (for firms)
Recommended Standard Definition
Use this for most teams:
Close complete = all required account reviews + reconciliations signed off and period locked.
If you run a firm, track client delivery as a separate KPI. Client responsiveness can distort internal close performance.
Common Mistakes With Days-to-Close Reporting
These mistakes make your month end close benchmarks look better than reality.
- Starting the timer late, like after bank feeds settle
- Ending the timer early, before review actually finishes
- Excluding cleanup done “outside” the close window
- Ignoring reopened items because they feel embarrassing
A practical example from a controller team I worked with:
They reported a 4-day close. They also posted 35 post-close entries.
They had a “shadow close” that lasted two more weeks. The KPI lied.
Month-End Close Benchmarks: What “Good” Looks Like
Month end close benchmarks help you set targets and spot outliers. However, benchmarks only work when you match scope and definitions.
Use benchmarks as ranges. Do not use them as promises.
Why Benchmarks Are Tricky
Close speed depends on complexity and operating model. Two companies with the same revenue can have totally different closes.
Benchmarks get distorted by:
- Inventory and COGS complexity
- Multi-entity consolidation needs
- Revenue recognition and deferred revenue
- Decentralized spend and weak AP controls
- Client responsiveness for CAS teams
Still, benchmarks help you ask the right question. “Are we slow because we are complex, or because we have churn?”
Practical Benchmark Bands
These ranges show up often in practice:
- Basic close: ~3–7 business days
- Complex close: ~7–12+ business days
Pair these ranges with quality KPIs. A 4-day close with high adjustments is not “good.” It is just fast.
Benchmarking Checklist
Use this checklist before you compare month end close metrics across teams.
- Same scope (entities/clients included)
- Same definition of “close complete”
- Same account list and reconciliation policy
- Same materiality threshold for adjustments
- Same period type (avoid quarter/year-end distortions)
If you cannot match these items, compare trends inside each group instead.
Leading vs. Lagging Close Performance Metrics
Lagging metrics explain what happened after the fact. Leading metrics warn you early. You need both to manage close performance.
Lagging Indicators (What Happened)
These show outcomes. They work well for monthly reporting.
- Days to close metric
- Post-close adjustments
- Late journal entries
- Reopens after sign-off
- Material corrections
Lagging indicators support accountability. However, they do not help you on day 3 of close.
Leading Indicators (What Will Happen)
These predict delays and quality issues while you still have time.
- Reconciliation WIP aging
- Exception counts by category (cash, AR, AP, payroll, inventory)
- Review backlog entering day 2 and day 3
- Unresolved flux exceptions by risk tier
I rely on WIP aging the most. If high-risk accounts sit “in progress” too long, the close will slip. Or quality will.
Mini-Framework: “Exception Load” as a Predictor of Close Delays
Exception load predicts whether you will hit the target date.
Track:
- Total findings opened
- Findings closed per day
- Findings reopened
- Unresolved exceptions by risk tier
Then use a simple burn-down view:
- Open exceptions day 1
- Expected closure rate per day
- Gap to target
If the burn-down line flattens on day 2, you will miss day 5. Therefore, you need to pull review forward or reduce scope.
How to Build a Close KPI Dashboard That Doesn’t Create Bad Behavior
Build a dashboard that balances time and quality. Then assign ownership. This prevents speed-only behavior that increases risk.
The Minimum Viable Close Dashboard (One Screen)
Keep it to one screen. If the team cannot read it in 60 seconds, it will not help.
Include:
- Days to close (trend)
- On-time close rate
- Post-close adjustment rate
- Reconciliation exception rate
- Rework hours %
- Bottleneck stage aging (review queue age)
This set covers time, quality, rework, and efficiency. It also supports fast close decisions.
KPI Ownership: Who Is Accountable for What
Ownership prevents “everyone and no one” accountability.
A common model:
- Controller or CAS lead: time + predictability
- Senior reviewer: quality + exception standards
- Team leads: throughput + WIP control
Make ownership real. The owner should run the review meeting for their KPIs.
Avoid These Incentive Traps
These traps create fake performance.
- Rewarding speed while tolerating post-close cleanup
- Measuring “tasks completed” without measuring reopens
- Hiding exceptions to “hit the date”
- Using hours as a weapon instead of a signal
A rule that works: if you celebrate days to close, you must also show post-close adjustment rate in the same slide.
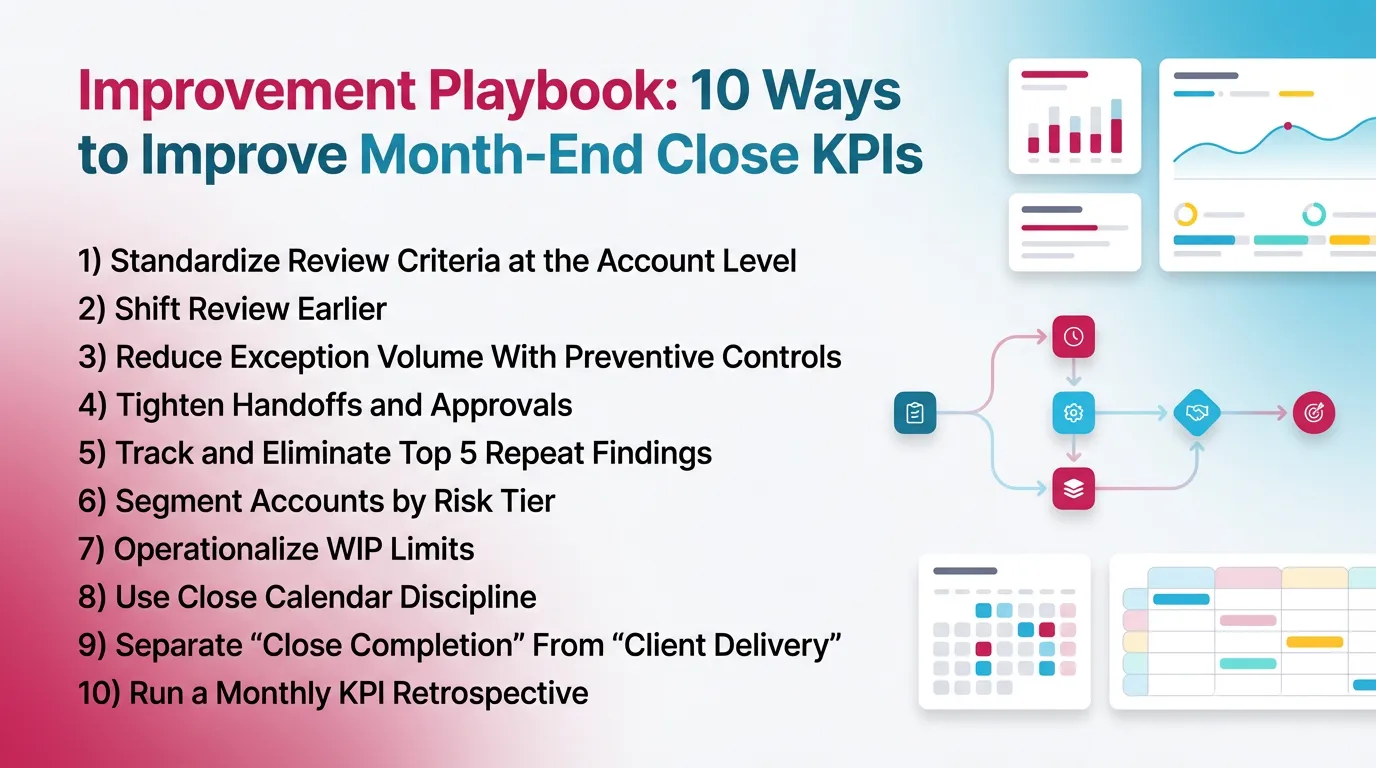
Improvement Playbook: 10 Ways to Improve Month-End Close KPIs
Each lever below ties to specific month-end close KPIs. Pick two per month. Then measure impact.
1) Standardize Review Criteria at the Account Level (P&L + Balance Sheet)
Define what “good” looks like for each account. Put it in writing.
Include:
- Flux thresholds
- Expected patterns
- Required support
- Common risks and checks
Outcome: fewer late discoveries. Lower rework hours %.
2) Shift Review Earlier (Don’t Batch It at the End)
Answer this question early: “Do we believe the numbers?”
Review high-risk accounts daily during the close window. Do not wait for day 5.
Outcome: reduced bottleneck days. Better predictability for the close cycle time KPI.
3) Reduce Exception Volume With Preventive Controls
Prevent the same issues from showing up every month.
Use:
- Templates for recurring support
- Standard journal entry packs
- Reconciliation cadence rules
- Clear cutoff policies
Outcome: fewer exceptions. Fewer reopens.
4) Tighten Handoffs and Approvals
Define “ready for review.” Do not send half-finished work to reviewers.
A practical “ready” standard:
- All support attached
- Tie-out completed
- Variances explained
- Reviewer notes anticipated
Outcome: fewer touches per account. Faster review cycles.
5) Track and Eliminate Top 5 Repeat Findings
Repeat findings kill close performance. They also kill morale.
Common repeat categories:
- Missing accruals
- Mapping issues
- Stale reconciliations
- Bank timing differences not explained
- Clearing accounts without owners
Outcome: improved quality KPIs month over month.
6) Segment Accounts by Risk Tier
Not every account deserves the same attention during close.
A simple tiering:
- Tier 1: cash, clearing, payroll liabilities, revenue, AR, AP
- Tier 2: prepaid, fixed assets, accrual buckets
- Tier 3: low-risk, low-activity accounts
Outcome: better effort allocation. Fewer material adjustments after close.
7) Operationalize WIP Limits
Too much WIP creates slow flow. It also hides stuck work.
Cap in-progress work:
- Max X reconciliations in progress per preparer
- Max Y items waiting for review per reviewer
Outcome: reduced WIP aging. Smoother throughput.
8) Use Close Calendar Discipline (But Don’t Confuse Calendar With Control)
A calendar helps coordination. It does not ensure quality.
Use the calendar to set:
- Cutoff times
- Review windows
- Escalation points
Then use exceptions and sign-offs as the real control.
Outcome: improved on-time close rate without lowering standards.
9) Separate “Close Completion” From “Client Delivery” (Firms)
Client delivery depends on client inputs. It should not change the internal “close complete” definition.
Track separately:
- Internal close complete date
- Client delivery date
- Client wait time
Outcome: cleaner KPI definitions. Better close performance metrics you can act on.
10) Run a Monthly KPI Retrospective (30 minutes)
Keep it short. Keep it honest.
Agenda:
- What moved?
- Why did it move?
- What will we change next month?
- Who owns each change?
Outcome: sustained improvement. Less random optimization.
Best Practices for Month-End Close KPI Tracking (What Mature Teams Do)
Mature teams treat KPI tracking as part of close operations. They do not treat it as extra reporting work.
Best Practices Checklist
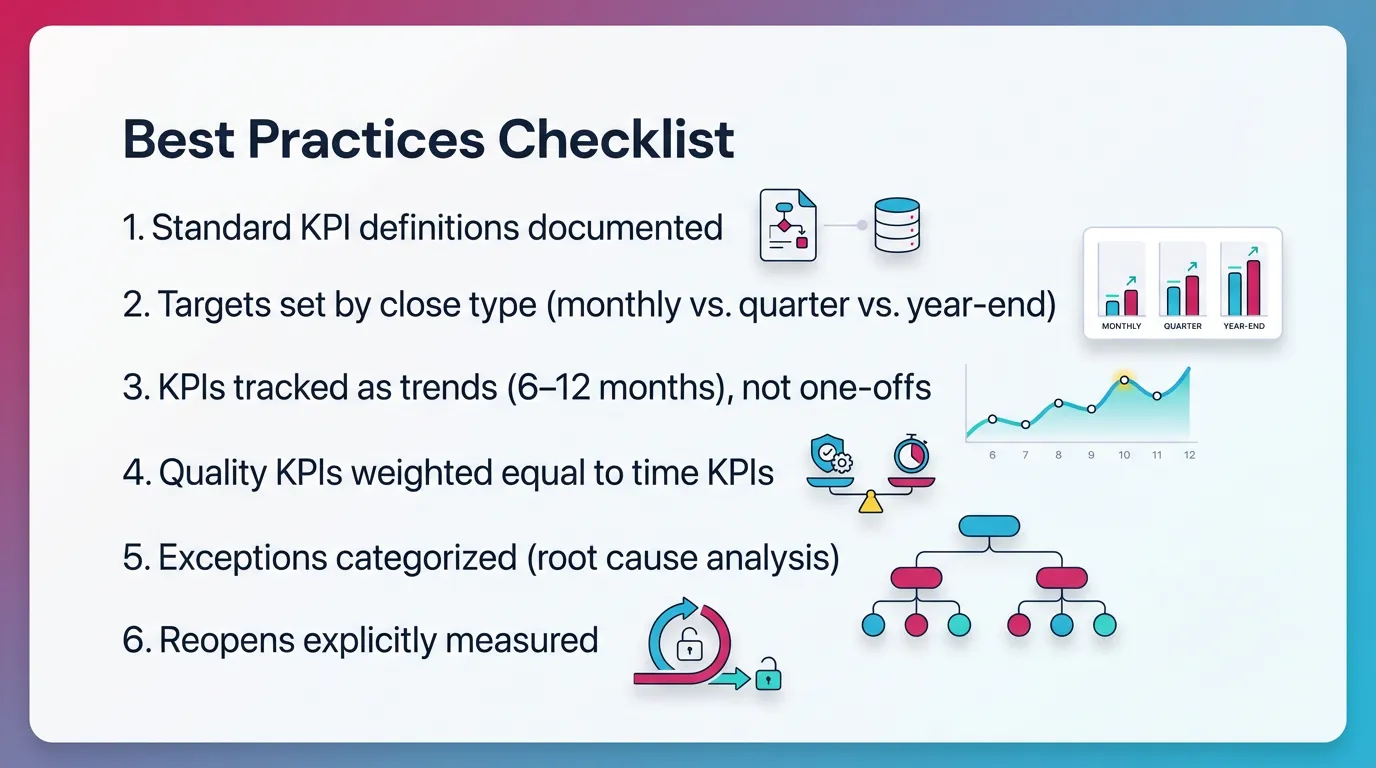
- Standard KPI definitions documented
- Targets set by close type (monthly vs. quarter vs. year-end)
- KPIs tracked as trends (6–12 months), not one-offs
- Quality KPIs weighted equal to time KPIs
- Exceptions categorized (root cause analysis)
- Reopens explicitly measured
- Dashboard reviewed at fixed cadence (weekly during close; monthly trend review)
Common Mistakes (That Inflate “Performance” While Risk Increases)
- Declaring close complete before review sign-off
- Not tracking post-close entries as a KPI
- Measuring hours without separating rework vs. planned work
- No segmentation by complexity (client/entity tiers)
- KPI overload (too many numbers, no decisions)
If you see “faster close” plus “more post-close entries,” you did not improve. You shifted work.
How Xenett Supports KPI-Driven Month-End Review Without Turning It Into “More Work”
Xenett helps teams operationalize month-end close KPIs by tying work to account-level review. This reduces late surprises and makes close performance metrics easier to trust.
Review-First KPI Improvement: Turning Findings Into Measurable Outcomes
Catch exceptions earlier to protect quality and time. That is the simplest path to better financial close KPIs.
Xenett uses an account-level financial review approach for P&L and balance sheet. This pushes “what looks wrong” to the front of the workflow.
Practical impact on KPIs:
- Lower late discovery rate
- Lower post-close adjustment rate
- Fewer reopened accounts after sign-off
Close Task and Checklist Management (Tied to Review Findings)
Generic checklists often create checkbox work. They can also hide real issues.
With Xenett, teams can organize close tasks around review findings. The work stays tied to the account and the explanation.
This supports:
- Better reconciliation exception rate tracking
- Cleaner handoffs
- Fewer touches per account because context stays in one place
Review and Approval Workflows (Consistency Across Reviewers)
Reviewer variance drives rework. One reviewer flags everything. Another flags nothing. The team then redoes work late.
Structured review standards help reviewers apply consistent rules. This typically reduces:
- Reopens
- Late-stage exceptions
- Close timeline variance
Visibility Into Close Status and Bottlenecks
Teams miss targets when they cannot see stuck work.
Xenett provides visibility into:
- What is open
- What is blocked
- What waits for review
That visibility supports leading indicators like:
- WIP aging
- Review queue aging
- Bottleneck days
Therefore, teams can fix flow problems before the days to close metric slips.
FAQ: Month-End Close KPIs
What are the most important month-end close KPIs?
The most important month-end close KPIs are days to close, on-time close rate, post-close adjustment rate, reconciliation exception rate, and rework %. They measure speed and quality together.
Use them as your baseline accounting KPIs for close. Then add efficiency metrics as needed.
What is the “days to close” metric?
The days to close metric is the time between period end and a standardized close complete event. Many teams define close complete as review sign-off plus period locked.
What’s a good month-end close benchmark?
Many teams target 3–7 business days for simpler environments and 7–12+ for complex ones. However, use month end close benchmarks with quality KPIs like post-close adjustments.
What are financial close KPIs vs. month-end close KPIs?
Financial close KPIs can cover month-end, quarter-end, and year-end. Month-end close KPIs cover the monthly subset. Use the same KPI set, but adjust targets for complexity.
How do you measure close accuracy?
Measure close accuracy with:
- Post-close adjustments
- Material post-close correction count and dollars
- Reconciliation exception rate
- Flux exception rate
Accuracy improves when teams resolve exceptions before they declare close complete.
What close performance metrics indicate too much rework?
These close performance metrics signal rework:
- High rework hours %
- High reopened tasks or reopened accounts
- High late discovery rate
If these rise, your close looks fast but runs unstable.
What’s the difference between close cycle time and close efficiency?
Close cycle time measures how long the close takes. Close efficiency measures the effort needed, like hours, touches, and bottleneck days, to hit acceptable quality.
How often should you review close KPIs?
Review daily during the close window for leading indicators like WIP aging. Review monthly for trends and root causes. This cadence supports continuous improvement.
Conclusion
Month end close KPIs work when they measure more than speed. Track time, quality, rework, and efficiency together. Standardize your definitions first. Then set targets that match your close type and complexity.
If you want to make these KPIs operational, start with one step. Define “close complete” and begin tracking reopens and post-close adjustments. Then add leading indicators like WIP aging.


.webp)